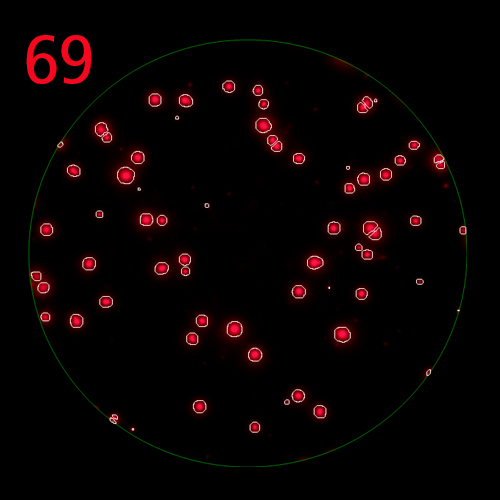
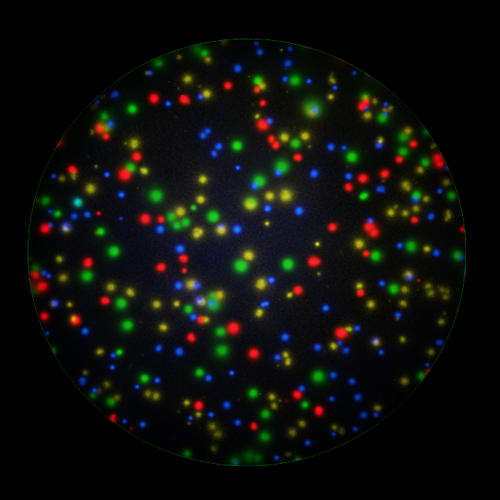
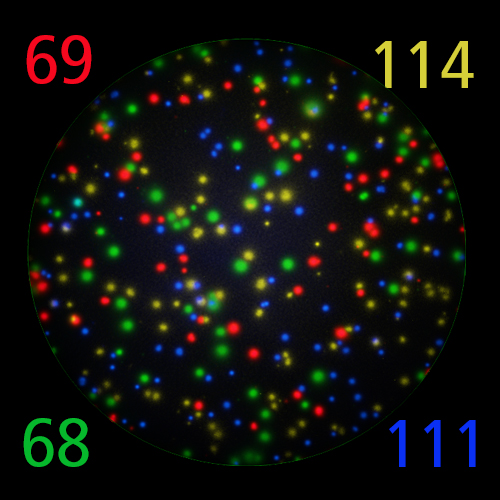
FluoroX™ Software Suite
For a priori reasons (specified below) fundamentally different approaches need to be implemented for the analysis of multi-color B cell and T cell FluoroSpot assays for accurate counting of single-vs. multiple positive spots, and high content data mining:
In B cell ImmunoSpot® Assays, the antibodies secreted by the individual antigen-specific B cells are captured around the secreting cell by the antigen itself. Thus, the affinity of the antibody that the individual B cell secretes becomes a major determinant of the spot morphology. Next to counting the mere number of antigen-specific B cells (measuring their clonal sizes for individual Ig classes and subclasses), high content analysis of the spot morphologies permits to establish the affinity distribution of the antigen-specific B cell repertoire. The FluoroX™ Software enables the latter by flow-cytometry-type data mining (see example).
As individual B cells secrete only one class or subclass of antibody with a unique antigen specificity/affinity, in multicolor B cell FluoroSpot assays double- or multiple-positive B cell spots result from random overlays of single color spots formed by closely situated cells. Multi-color B cell assays can therefore be accurately evaluated without counting of multicolor spots [ref].
In T cell ImmunoSpot® Assays, antigen-triggered analytes (cytokines or cytolytic molecules such as granzyme B or perforin) are captured around the secreting cell by analyte-specific antibodies. Due to the constant affinity of the monoclonal capture antibody for the analyte, spot morphologies are defined by the quantity of the analyte produced along with the secretion kinetics [ref].
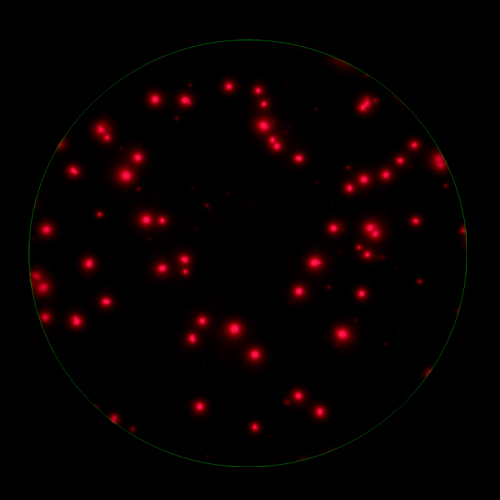
T cells co-express cytokines, and analyzing the co-expression patterns is central to defining T cell lineages and activation/exhaustion stages [ref]. Rigorous experimental validation showed that for the identification of multi-color FluoroSpots generated by cytokine co-expressing T cells the Center of Mass Distance Algorithm needs to be used [ref]. Implementing Center of Mass Distance Algorithms, the FluoroX™ Software permits accurate identification of cytokine co-expressing individual T cells while compensating for asynchronous cytokine production in conjunction with cell movements.
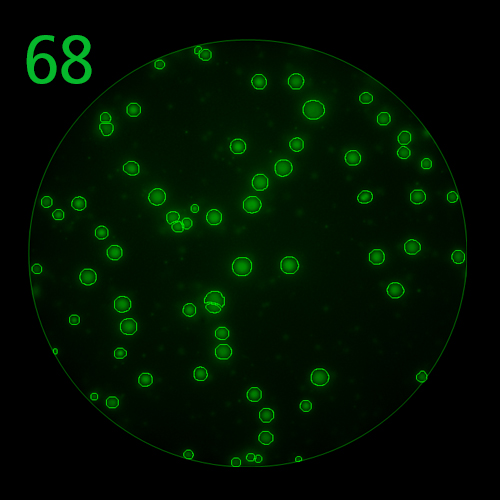
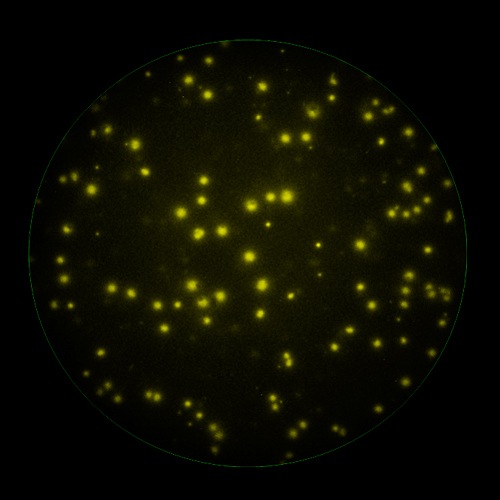
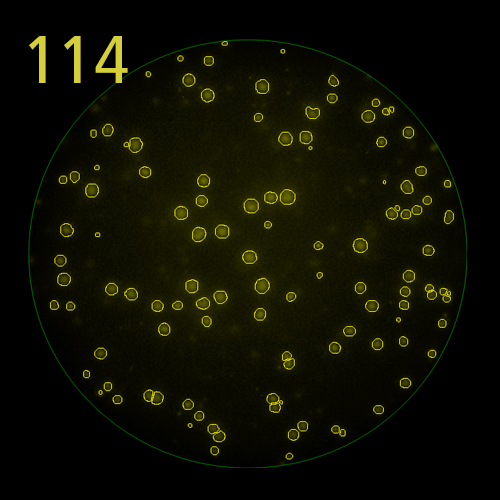
The FluoroX™ Software supports analysis of high bit rate and HDR images. Conventional FluoroSpot relies on the analysis of a single image (for each channel in multi-color assays) of a well, captured using a single exposure time. This approach is more than adequate for the accurate counting of spots within a narrow intensity range; however it may not be sufficient to accommodate spot intensities that are significantly different. If a single image exposure is too low, faint spots will be missed, at the same time, overly bright spots will be over-exposed, and their intensity profiles lost. In HDR imaging, a series of images are taken with incremental exposure times, and a single HDR image containing all this information is generated. Thus, spots at both the low and high ends of the intensity range are captured with exposure times optimal for the accurate detection of each, permitting to cover the full dynamic range of spot intensities. (Learn more).
FluoroX™ also supports flow-cytometry-type analysis of analyte quantities and co-expression patterns.
Learn more about the regulatory compliance of CTL’s FluoroX™ Software.


